Rainfall scenarios
Explore 25 mm and 50 mm events over 30 minutes, followed by 30 minutes without rain.

Aerial Intelligence / Water modeling
A visual guide to hypothetical rainfall and runoff for management and leadership teams. Explore two construction settings—mining and infrastructure—through shared maps, scenarios and clear comparisons.
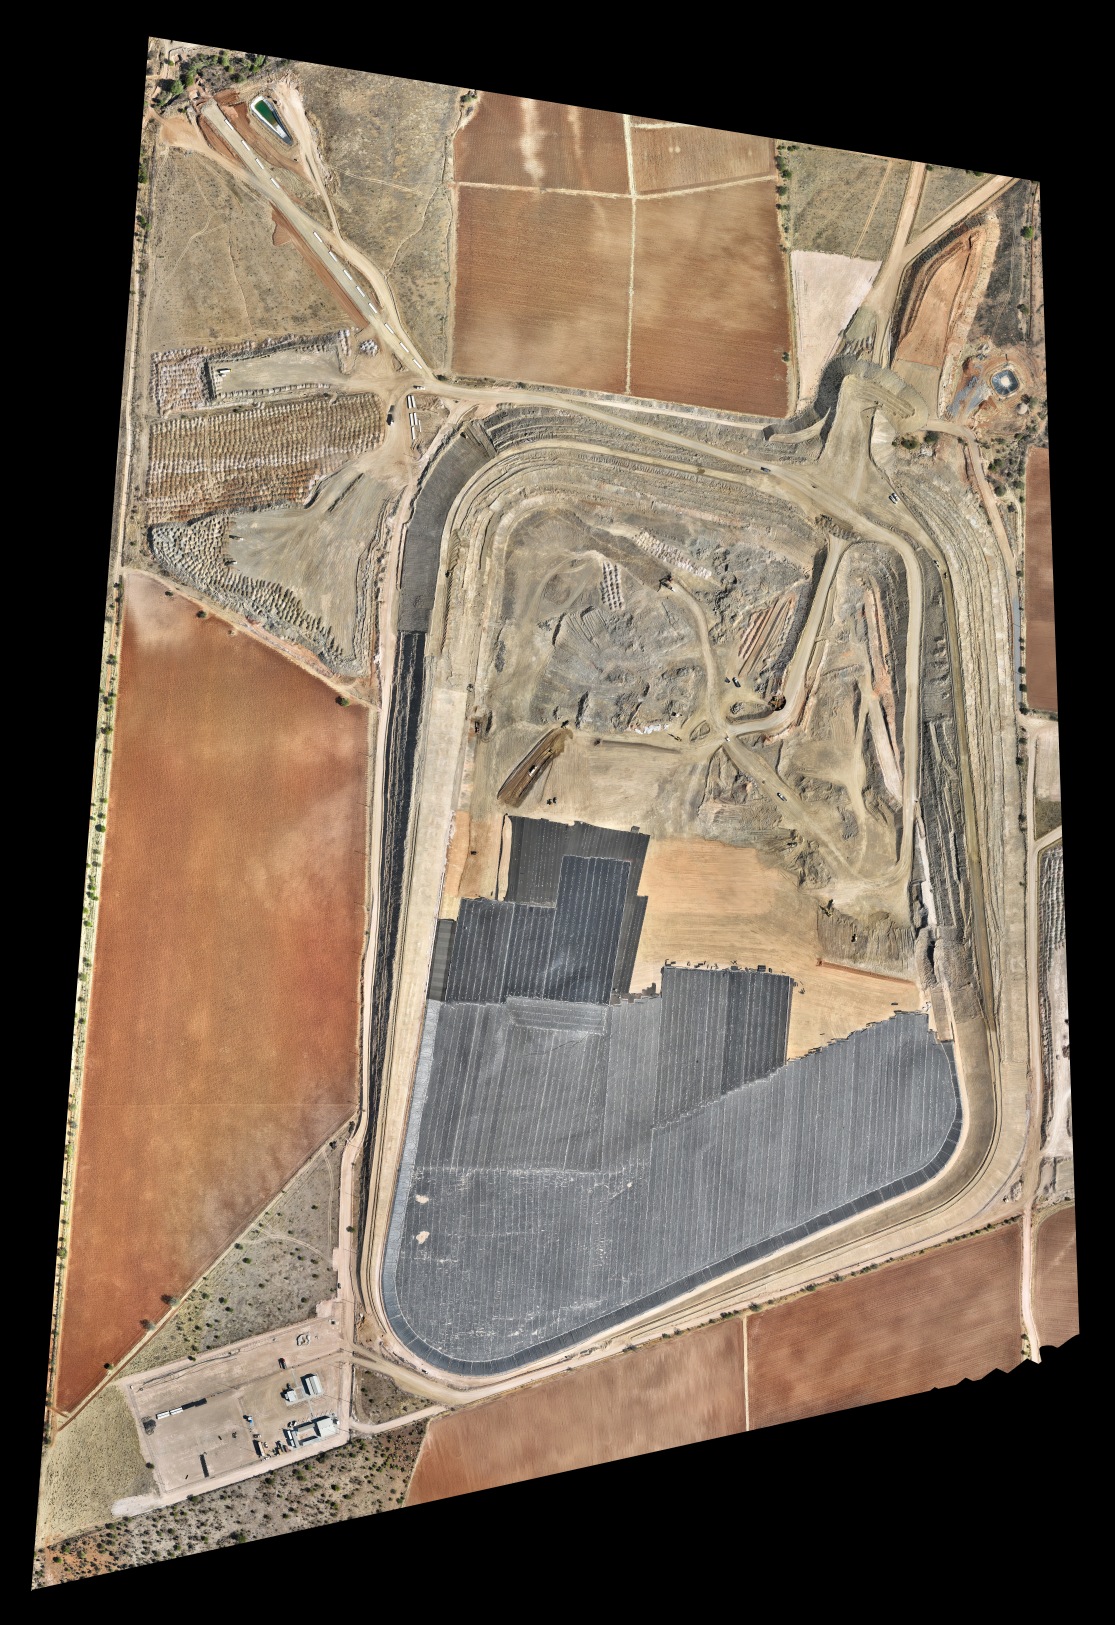
Mining industry
Explore hypothetical surface-water accumulation around earthworks and containment geometry.
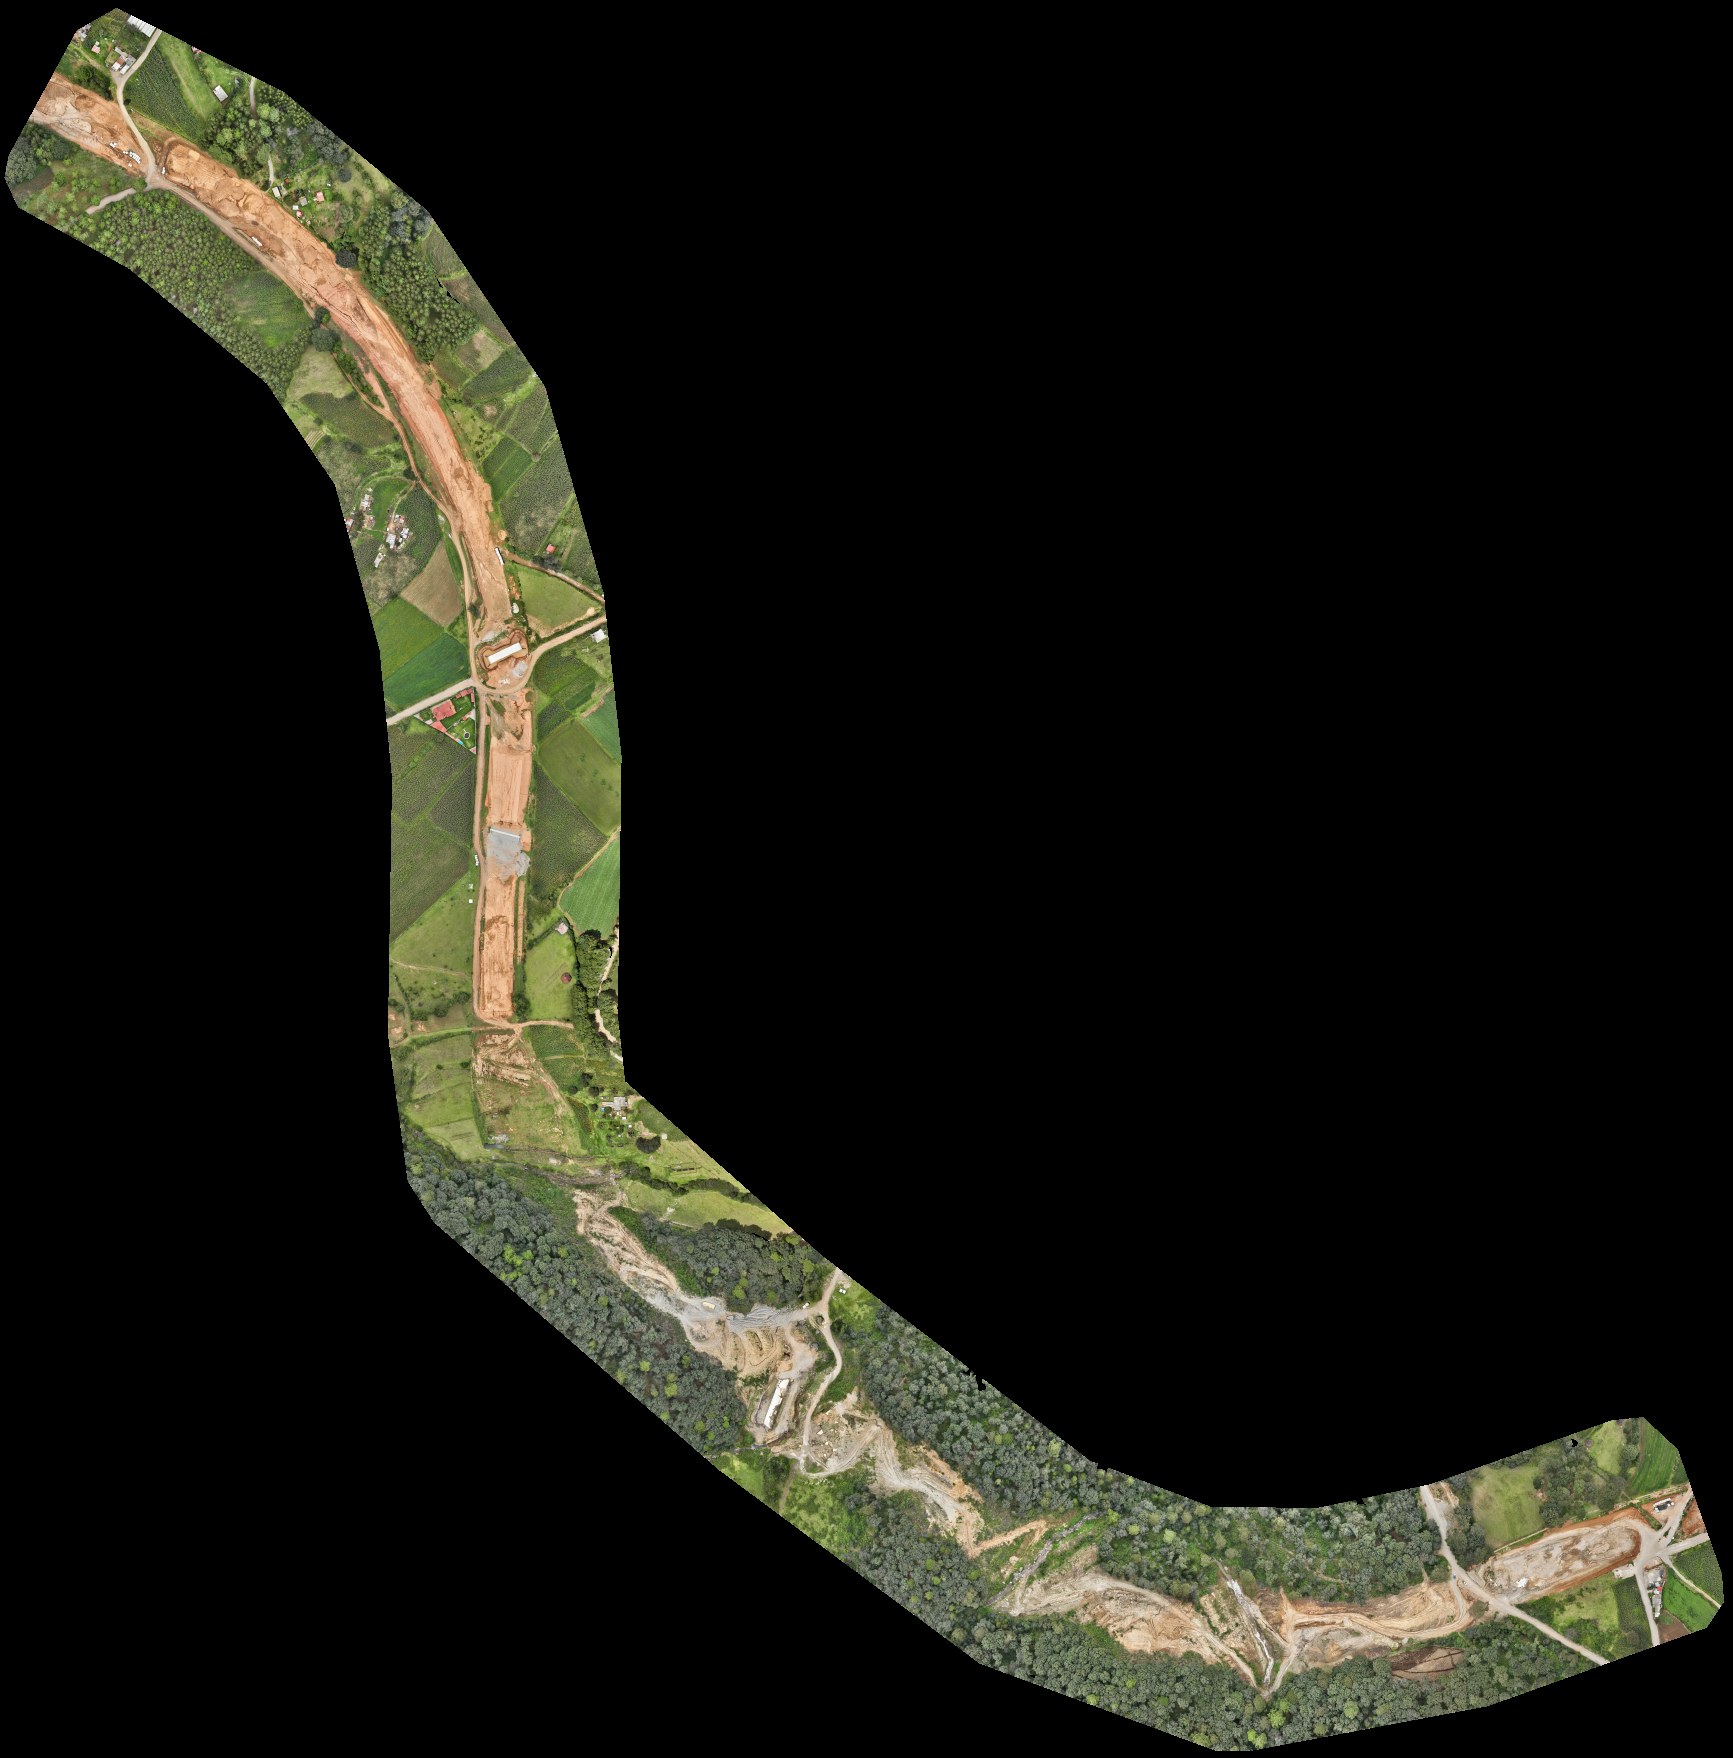
Infrastructure industry
Explore how surveyed slopes and earthworks influence simulated runoff along a construction corridor.
The proof of concept
Aerial surveys provide a detailed record of a site’s surface. This experiment uses that terrain as the input to a numerical surface-water model, then presents the results for comparison and discussion.
What changes when rainfall increases? How does an infiltration assumption affect surface water? How sensitive are the results to the model’s grid size?
The surveys are real. The rainfall scenarios are hypothetical. The outputs are uncalibrated calculations, not observations of flooding or validated engineering predictions.
One method / Two applications
Each example provides its own terrain and independently computed scenarios. Compare alternatives within a site; the two sites are not a controlled comparison of risk.
Explore 25 mm and 50 mm events over 30 minutes, followed by 30 minutes without rain.
Select a location to inspect simulated depth through time and its full-run maximum.
Compare 5 m and 10 m grids and an assumed infiltration case, with the same depth colours.
Explore how the rainfall assumptions affect simulated surface water. Select a location to compare the results. This example does not represent a tailings release or embankment failure.
Explore how slopes and earthworks influence simulated runoff. Buried drainage and external inflows are not represented; apparent ponding requires site verification.
A shared view for leadership
Where engineering studies and monitoring systems already exist, a shared visual guide can help management, operations and specialists discuss the same information in its physical context.
Locate a question on the map and see the surrounding terrain. Connect technical discussion with a view that colleagues can explore together.
See how different rainfall scenarios affect the modeled result. Keep assumptions and limitations alongside the visuals when sharing them.
With additional comparable surveys and documented model versions, the same approach could help teams review changing site conditions and follow up on decisions.
This preview compares scenarios on one survey per site and shows simulated time within each event. It does not yet compare successive surveys or integrate a client’s engineering systems.
Survey-derived terrain with hypothetical surface-water calculations. The results illustrate scenarios; they are not observed flooding, a safety rating or a validated prediction.
Landlab OverlandFlow uses a local-inertial approximation to shallow-water flow. AI assisted the code and presentation; depths come from the numerical solver. Each viewer includes its assumptions and checks.
Rainfall and surface resistance are assumed uniform. Model perimeters are artificial; upstream inflows and buried drainage are omitted. Elevation units are provisionally metres, with vertical references and survey accuracy awaiting verification.
A scenario changes model assumptions on the same terrain. The timeline represents minutes within a simulated event. Comparing actual change over time requires additional comparable surveys.
No breach, slurry release, seepage, stability, compliance or engineering assessment is provided. Site-specific calibration and qualified review are required before operational use.
Depth is simulated water above the modeled ground. Grid size is the terrain averaging scale; finer cells do not by themselves prove greater accuracy. Numerical consistency checks do not establish field accuracy.